4.7.1.3. Dihedral angles analysis — MDAnalysis.analysis.dihedrals
- Author
Henry Mull
- Year
2018
- Copyright
GNU Public License v2
New in version 0.19.0.
This module contains classes for calculating dihedral angles for a given set of atoms or residues. This can be done for selected frames or whole trajectories.
A list of time steps that contain angles of interest is generated and can be
easily plotted if desired. For the Ramachandran
and Janin classes, basic plots can be
generated using the method Ramachandran.plot() or Janin.plot().
These plots are best used as references, but they also allow for user customization.
See also
MDAnalysis.lib.distances.calc_dihedrals()function to calculate dihedral angles from atom positions
4.7.1.3.1. Example applications
4.7.1.3.1.1. General dihedral analysis
The Dihedral class is useful for calculating
angles for many dihedrals of interest. For example, we can find the phi angles
for residues 5-10 of adenylate kinase (AdK). The trajectory is included within
the test data files:
import MDAnalysis as mda
from MDAnalysisTests.datafiles import GRO, XTC
u = mda.Universe(GRO, XTC)

# selection of atomgroups
ags = [res.phi_selection() for res in u.residues[4:9]]

from MDAnalysis.analysis.dihedrals import Dihedral
R = Dihedral(ags).run()
The angles can then be accessed with Dihedral.results.angles.
4.7.1.3.1.2. Ramachandran analysis
The Ramachandran class allows for the
quick calculation of classical Ramachandran plots [Ramachandran1963] in the
backbone \(phi\) and \(psi\) angles. Unlike the
Dihedral class which takes a list of
atomgroups, this class only needs a list of residues or atoms from those
residues. The previous example can repeated with:
u = mda.Universe(GRO, XTC)
r = u.select_atoms("resid 5-10")

R = Ramachandran(r).run()
Then it can be plotted using the built-in plotting method Ramachandran.plot():
import matplotlib.pyplot as plt
fig, ax = plt.subplots(figsize=plt.figaspect(1))
R.plot(ax=ax, color='k', marker='o', ref=True)
fig.tight_layout()
as shown in the example Ramachandran plot figure.
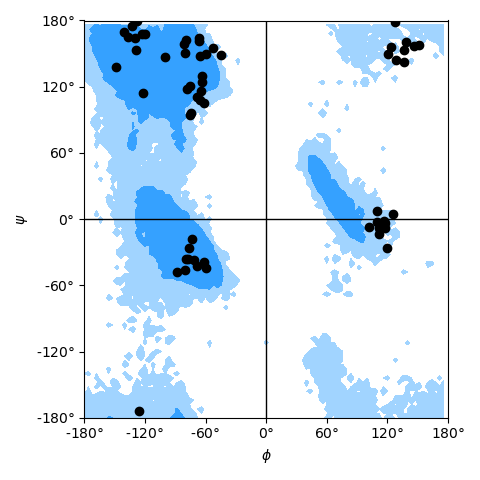
Ramachandran plot for residues 5 to 10 of AdK, sampled from the AdK test trajectory (XTC). The contours in the background are the “allowed region” and the “marginally allowed” regions.
To plot the data yourself, the angles can be accessed using
Ramachandran.results.angles.
Note
The Ramachandran analysis is prone to errors if the topology contains
duplicate or missing atoms (e.g. atoms with altloc or incomplete
residues). If the topology has as an altloc attribute, you must specify
only one altloc for the atoms with more than one ("protein and not
altloc B").
4.7.1.3.1.3. Janin analysis
Janin plots [Janin1978] for side chain conformations (\(\chi_1\) and
\(chi_2\) angles) can be created with the
Janin class. It works in the same way,
only needing a list of residues; see the Janin plot figure as an example.
The data for the angles can be accessed in the attribute
Janin.results.angles.
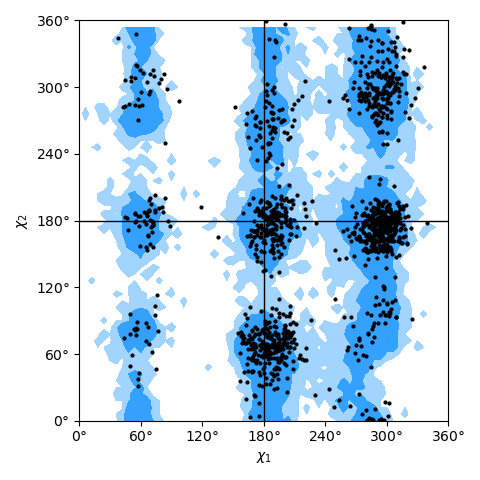
Janin plot for all residues of AdK, sampled from the AdK test trajectory (XTC). The contours in the background are the “allowed region” and the “marginally allowed” regions for all possible residues.
Note
The Janin analysis is prone to errors if the topology contains duplicate or
missing atoms (e.g. atoms with altloc or incomplete residues). If the
topology has as an altloc attribute, you must specify only one altloc
for the atoms with more than one ("protein and not altloc B").
Furthermore, many residues do not have a \(\chi_2\) dihedral and if the
selections of residues is not carefully filtered to only include those
residues with both sidechain dihedrals then a ValueError with the
message Too many or too few atoms selected is raised.
4.7.1.3.1.4. Reference plots
Reference plots can be added to the axes for both the Ramachandran and Janin
classes using the kwarg ref=True for the Ramachandran.plot()
and Janin.plot() methods. The Ramachandran reference data
(Rama_ref) and Janin reference data
(Janin_ref) were made using data
obtained from a large selection of 500 PDB files, and were analyzed using these
classes [Mull2018]. The allowed and marginally allowed regions of the
Ramachandran reference plot have cutoffs set to include 90% and 99% of the data
points, and the Janin reference plot has cutoffs for 90% and 98% of the data
points. The list of PDB files used for the reference plots was taken from
[Lovell2003] and information about general Janin regions was taken from
[Janin1978].
4.7.1.3.2. Analysis Classes
- class MDAnalysis.analysis.dihedrals.Dihedral(atomgroups, **kwargs)[source]
Calculate dihedral angles for specified atomgroups.
Dihedral angles will be calculated for each atomgroup that is given for each step in the trajectory. Each
AtomGroupmust contain 4 atoms.Note
This class takes a list as an input and is most useful for a large selection of atomgroups. If there is only one atomgroup of interest, then it must be given as a list of one atomgroup.
Changed in version 2.0.0:
anglesresults are now stored in aMDAnalysis.analysis.base.Resultsinstance.- Parameters
atomgroups (list[AtomGroup]) – a list of
AtomGroupfor which the dihedral angles are calculated- Raises
ValueError – If any atomgroups do not contain 4 atoms
- results.angles
Contains the time steps of the angles for each atomgroup in the list as an
n_frames×len(atomgroups)numpy.ndarraywith content[[angle 1, angle 2, ...], [time step 2], ...].New in version 2.0.0.
- angles
Alias to the
results.anglesattribute.Deprecated since version 2.0.0: Will be removed in MDAnalysis 3.0.0. Please use
results.anglesinstead.
- run(start=None, stop=None, step=None, verbose=None)
Perform the calculation
- class MDAnalysis.analysis.dihedrals.Ramachandran(atomgroup, c_name='C', n_name='N', ca_name='CA', check_protein=True, **kwargs)[source]
Calculate \(\phi\) and \(\psi\) dihedral angles of selected residues.
\(\phi\) and \(\psi\) angles will be calculated for each residue corresponding to atomgroup for each time step in the trajectory. A
ResidueGroupis generated from atomgroup which is compared to the protein to determine if it is a legitimate selection.- Parameters
atomgroup (AtomGroup or ResidueGroup) – atoms for residues for which \(\phi\) and \(\psi\) are calculated
c_name (str (optional)) – name for the backbone C atom
n_name (str (optional)) – name for the backbone N atom
ca_name (str (optional)) – name for the alpha-carbon atom
check_protein (bool (optional)) – whether to raise an error if the provided atomgroup is not a subset of protein atoms
Example
For standard proteins, the default arguments will suffice to run a Ramachandran analysis:
r = Ramachandran(u.select_atoms('protein')).run()
For proteins with non-standard residues, or for calculating dihedral angles for other linear polymers, you can switch off the protein checking and provide your own atom names in place of the typical peptide backbone atoms:
r = Ramachandran(u.atoms, c_name='CX', n_name='NT', ca_name='S',
                 check_protein=False).run()
The above analysis will calculate angles from a “phi” selection of CX’-NT-S-CX and “psi” selections of NT-S-CX-NT’.
- Raises
ValueError – If the selection of residues is not contained within the protein and
check_proteinisTrue
Note
If
check_proteinisTrueand the residue selection is beyond the scope of the protein and, then an error will be raised. If the residue selection includes the first or last residue, then a warning will be raised and they will be removed from the list of residues, but the analysis will still run. If a \(\phi\) or \(\psi\) selection cannot be made, that residue will be removed from the analysis.Changed in version 1.0.0: added c_name, n_name, ca_name, and check_protein keyword arguments
Changed in version 2.0.0:
anglesresults are now stored in aMDAnalysis.analysis.base.Resultsinstance.- results.angles
Contains the time steps of the \(\phi\) and \(\psi\) angles for each residue as an
n_frames×n_residues×2numpy.ndarraywith content[[[phi, psi], [residue 2], ...], [time step 2], ...].New in version 2.0.0.
- angles
Alias to the
results.anglesattribute.Deprecated since version 2.0.0: Will be removed in MDAnalysis 3.0.0. Please use
results.anglesinstead.
- plot(ax=None, ref=False, **kwargs)[source]
Plots data into standard Ramachandran plot.
Each time step in
Ramachandran.results.anglesis plotted onto the same graph.- Parameters
ax (
matplotlib.axes.Axes) – If no ax is supplied or set toNonethen the plot will be added to the current active axes.ref (bool, optional) – Adds a general Ramachandran plot which shows allowed and marginally allowed regions
kwargs (optional) – All other kwargs are passed to
matplotlib.pyplot.scatter().
- Returns
ax – Axes with the plot, either ax or the current axes.
- Return type
- run(start=None, stop=None, step=None, verbose=None)
Perform the calculation
- class MDAnalysis.analysis.dihedrals.Janin(atomgroup, select_remove='resname ALA CYS* GLY PRO SER THR VAL', select_protein='protein', **kwargs)[source]
Calculate \(\chi_1\) and \(\chi_2\) dihedral angles of selected residues.
\(\chi_1\) and \(\chi_2\) angles will be calculated for each residue corresponding to atomgroup for each time step in the trajectory. A
ResidueGroupis generated from atomgroup which is compared to the protein to determine if it is a legitimate selection.Note
If the residue selection is beyond the scope of the protein, then an error will be raised. If the residue selection includes the residues ALA, CYS*, GLY, PRO, SER, THR, or VAL (the default of the select_remove keyword argument) then a warning will be raised and they will be removed from the list of residues, but the analysis will still run. Some topologies have altloc attribues which can add duplicate atoms to the selection and must be removed.
- Parameters
atomgroup (AtomGroup or ResidueGroup) – atoms for residues for which \(\chi_1\) and \(\chi_2\) are calculated
select_remove (str) – selection string to remove residues that do not have \(chi_2\) angles
select_protein (str) – selection string to subselect protein-only residues from atomgroup to check that only amino acids are selected; if you have non-standard amino acids then adjust this selection to include them
- Raises
ValueError – if the final selection of residues is not contained within the protein (as determined by
atomgroup.select_atoms(select_protein))ValueError – if not enough or too many atoms are found for a residue in the selection, usually due to missing atoms or alternative locations, or due to non-standard residues
Changed in version 2.0.0: select_remove and select_protein keywords were added.
anglesresults are now stored in aMDAnalysis.analysis.base.Resultsinstance.- results.angles
Contains the time steps of the \(\chi_1\) and \(\chi_2\) angles for each residue as an
n_frames×n_residues×2numpy.ndarraywith content[[[chi1, chi2], [residue 2], ...], [time step 2], ...].New in version 2.0.0.
- angles
Alias to the
results.anglesattribute.Deprecated since version 2.0.0: Will be removed in MDAnalysis 3.0.0. Please use
results.anglesinstead.
- plot(ax=None, ref=False, **kwargs)[source]
Plots data into standard Janin plot.
Each time step in
Janin.results.anglesis plotted onto the same graph.- Parameters
ax (
matplotlib.axes.Axes) – If no ax is supplied or set toNonethen the plot will be added to the current active axes.ref (bool, optional) – Adds a general Janin plot which shows allowed and marginally allowed regions
kwargs (optional) – All other kwargs are passed to
matplotlib.pyplot.scatter().
- Returns
ax – Axes with the plot, either ax or the current axes.
- Return type
- run(start=None, stop=None, step=None, verbose=None)
Perform the calculation
References
- Ramachandran1963
G. Ramachandran, C. Ramakrishnan, and V. Sasisekharan. (1963) Stereochemistry of polypeptide chain configurations. Journal of Molecular Biology, 7(1):95 – 99. doi: 10.1016/S0022-2836(63)80023-6
- Janin1978(1,2)
Joël Janin, Shoshanna Wodak, Michael Levitt, and Bernard Maigret. (1978). “Conformation of amino acid side-chains in proteins”. Journal of Molecular Biology 125(3): 357-386. doi: 10.1016/0022-2836(78)90408-4
- Lovell2003
Simon C. Lovell, Ian W. Davis, W. Bryan Arendall III, Paul I. W. de Bakker, J. Michael Word, Michael G. Prisant, Jane S. Richardson, and David C. Richardson (2003). “Structure validation by \(C_{\alpha}\) geometry: \(\phi\), \(\psi\), and \(C_{\beta}\) deviation”. Proteins 50(3): 437-450. doi: 10.1002/prot.10286
- Mull2018
H. Mull and O. Beckstein. SPIDAL Summer REU 2018 Dihedral Analysis in MDAnalysis. Technical report, Arizona State University, 8 2018. doi: 10.6084/m9.figshare.6957296