12.1.1. Streamplots (2D) — MDAnalysis.visualization.streamlines
| Authors: | Tyler Reddy and Matthieu Chavent |
|---|---|
| Year: | 2014 |
| Copyright: | GNU Public License v3 |
| Citation: | [Chavent2014] |
The generate_streamlines() function can generate a 2D flow field from a
MD trajectory, for instance, lipid molecules in a flat membrane. It can make
use of multiple cores to perform the analyis in parallel (using
multiprocessing).
See also
MDAnalysis.visualization.streamlines_3D- streamplots in 3D
-
MDAnalysis.visualization.streamlines.generate_streamlines(topology_file_path, trajectory_file_path, grid_spacing, MDA_selection, start_frame, end_frame, xmin, xmax, ymin, ymax, maximum_delta_magnitude, num_cores='maximum')[source]¶ Produce the x and y components of a 2D streamplot data set.
Parameters: - topology_file_path (str) – Absolute path to the topology file
- trajectory_file_path (str) – Absolute path to the trajectory file. It will normally be desirable to filter the trajectory with a tool such as GROMACS g_filter (see [Chavent2014])
- grid_spacing (float) – The spacing between grid lines (angstroms)
- MDA_selection (str) – MDAnalysis selection string
- start_frame (int) – First frame number to parse
- end_frame (int) – Last frame number to parse
- xmin (float) – Minimum coordinate boundary for x-axis (angstroms)
- xmax (float) – Maximum coordinate boundary for x-axis (angstroms)
- ymin (float) – Minimum coordinate boundary for y-axis (angstroms)
- ymax (float) – Maximum coordinate boundary for y-axis (angstroms)
- maximum_delta_magnitude (float) – Absolute value of the largest displacement tolerated for the centroid of a group of particles ( angstroms). Values above this displacement will not count in the streamplot (treated as excessively large displacements crossing the periodic boundary)
- num_cores (int or 'maximum' (optional)) – The number of cores to use. (Default ‘maximum’ uses all available cores)
Returns: - dx_array (array of floats) – An array object containing the displacements in the x direction
- dy_array (array of floats) – An array object containing the displacements in the y direction
- average_displacement (float) – \(\frac{\sum\sqrt[]{dx^2 + dy^2}}{N}\)
- standard_deviation_of_displacement (float) – standard deviation of \(\sqrt[]{dx^2 + dy^2}\)
Examples
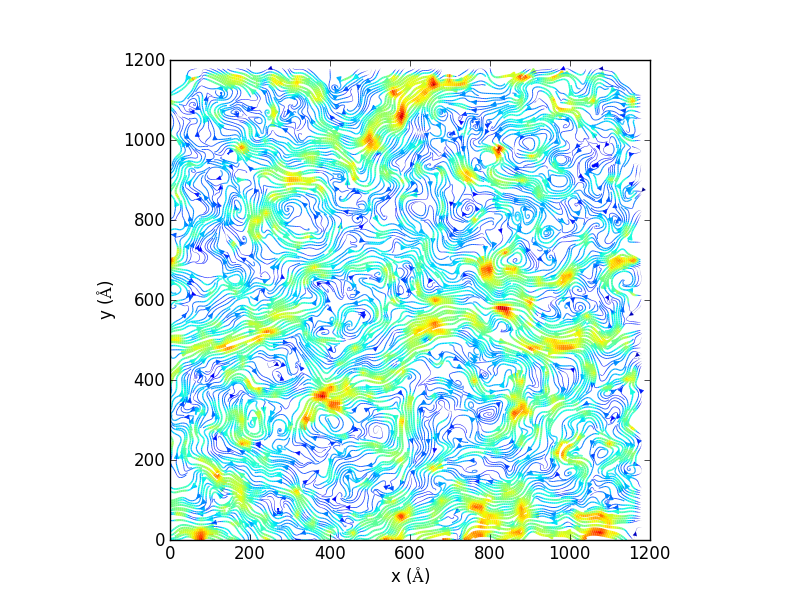
Generate 2D streamlines and plot:
import matplotlib, matplotlib.pyplot, np
import MDAnalysis, MDAnalysis.visualization.streamlines

u1, v1, average_displacement, standard_deviation_of_displacement =
    MDAnalysis.visualization.streamlines.generate_streamlines('testing.gro', 'testing_filtered.xtc',
            grid_spacing=20, MDA_selection='name PO4', start_frame=2, end_frame=3,
            xmin=-8.73000049591, xmax= 1225.96008301,
            ymin= -12.5799999237, ymax=1224.34008789,
            maximum_delta_magnitude=1.0, num_cores=16)
x = np.linspace(0, 1200, 61)
y = np.linspace(0, 1200, 61)
speed = np.sqrt(u1*u1 + v1*v1)
fig = matplotlib.pyplot.figure()
ax = fig.add_subplot(111, aspect='equal')
ax.set_xlabel('x ($\AA$)')
ax.set_ylabel('y ($\AA$)')
ax.streamplot(x, y, u1, v1, density=(10,10), color=speed, linewidth=3*speed/speed.max())
fig.savefig('testing_streamline.png',dpi=300)
References
[Chavent2014] (1, 2) Chavent, M.*, Reddy, T.*, Dahl, C.E., Goose, J., Jobard, B., and Sansom, M.S.P. Methodologies for the analysis of instantaneous lipid diffusion in MD simulations of large membrane systems. Faraday Discussions 169 (2014), 455–475. doi: 10.1039/c3fd00145h