13.1.2. Streamplots (3D) — MDAnalysis.visualization.streamlines_3D
- Authors:
Tyler Reddy and Matthieu Chavent
- Year:
2014
- Copyright:
Lesser GNU Public License v2.1+
The generate_streamlines_3d() function can generate a 3D flow field from
a MD trajectory, for instance, lipid molecules in a virus capsid. It can make
use of multiple cores to perform the analyis in parallel (using
multiprocessing).
See also
MDAnalysis.visualization.streamlinesstreamplots in 2D
- MDAnalysis.visualization.streamlines_3D.generate_streamlines_3d(topology_file_path, trajectory_file_path, grid_spacing, MDA_selection, start_frame, end_frame, xmin, xmax, ymin, ymax, zmin, zmax, maximum_delta_magnitude=2.0, num_cores='maximum')[source]
Produce the x, y and z components of a 3D streamplot data set.
- Parameters:
topology_file_path (str) – Absolute path to the topology file
trajectory_file_path (str) – Absolute path to the trajectory file. It will normally be desirable to filter the trajectory with a tool such as GROMACS g_filter (see [1])
grid_spacing (float) – The spacing between grid lines (angstroms)
MDA_selection (str) – MDAnalysis selection string
start_frame (int) – First frame number to parse
end_frame (int) – Last frame number to parse
xmin (float) – Minimum coordinate boundary for x-axis (angstroms)
xmax (float) – Maximum coordinate boundary for x-axis (angstroms)
ymin (float) – Minimum coordinate boundary for y-axis (angstroms)
ymax (float) – Maximum coordinate boundary for y-axis (angstroms)
maximum_delta_magnitude (float) – Absolute value of the largest displacement tolerated for the centroid of a group of particles ( angstroms). Values above this displacement will not count in the streamplot (treated as excessively large displacements crossing the periodic boundary)
num_cores (int or 'maximum' (optional)) – The number of cores to use. (Default ‘maximum’ uses all available cores)
- Returns:
dx_array (array of floats) – An array object containing the displacements in the x direction
dy_array (array of floats) – An array object containing the displacements in the y direction
dz_array (array of floats) – An array object containing the displacements in the z direction
Examples
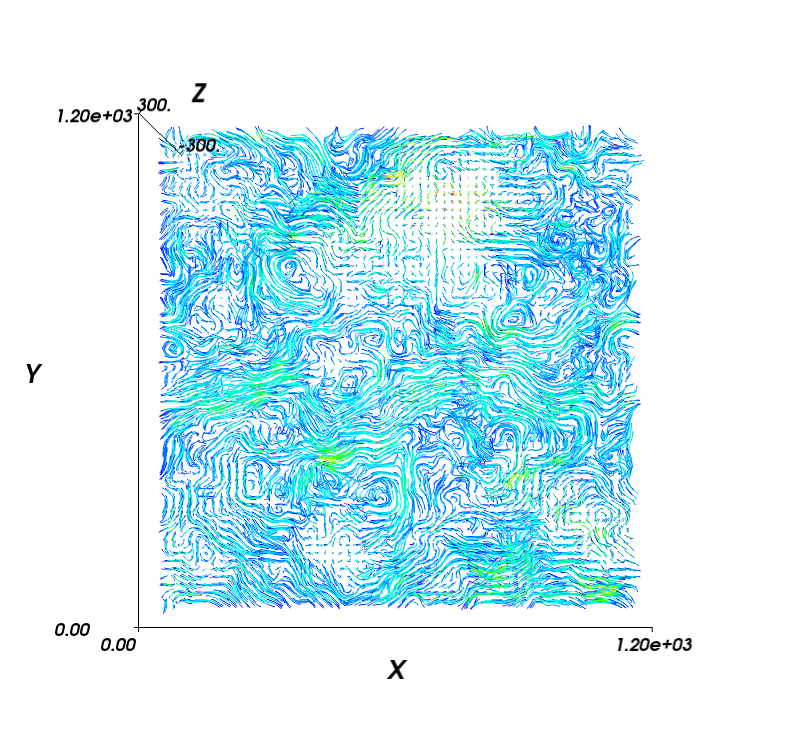
Generate 3D streamlines and visualize in mayavi:
import numpy as np

import MDAnalysis
import MDAnalysis.visualization.streamlines_3D

import mayavi, mayavi.mlab

# assign coordinate system limits and grid spacing:
x_lower,x_upper = -8.73, 1225.96
y_lower,y_upper = -12.58, 1224.34
z_lower,z_upper = -300, 300
grid_spacing_value = 20

x1, y1, z1 = MDAnalysis.visualization.streamlines_3D.generate_streamlines_3d(
                'testing.gro', 'testing_filtered.xtc',
                 xmin=x_lower, xmax=x_upper,
                 ymin=y_lower, ymax=y_upper,
                 zmin=z_lower, zmax=z_upper,
                 grid_spacing=grid_spacing_value, MDA_selection = 'name PO4',
                 start_frame=2, end_frame=3, num_cores='maximum')

x, y, z = np.mgrid[x_lower:x_upper:x1.shape[0]*1j,
                  y_lower:y_upper:y1.shape[1]*1j,
                  z_lower:z_upper:z1.shape[2]*1j]

# plot with mayavi:
fig = mayavi.mlab.figure(bgcolor=(1.0, 1.0, 1.0), size=(800, 800), fgcolor=(0, 0, 0))
for z_value in np.arange(z_lower, z_upper, grid_spacing_value):
    st = mayavi.mlab.flow(x, y, z, x1, y1, z1, line_width=1,
                          seedtype='plane', integration_direction='both')
    st.streamline_type = 'tube'
    st.tube_filter.radius = 2
    st.seed.widget.origin = np.array([ x_lower,  y_upper,   z_value])
    st.seed.widget.point1 = np.array([ x_upper, y_upper,  z_value])
    st.seed.widget.point2 = np.array([ x_lower, y_lower,  z_value])
    st.seed.widget.resolution = int(x1.shape[0])
    st.seed.widget.enabled = False
mayavi.mlab.axes(extent = [0, 1200, 0, 1200, -300, 300])
fig.scene.z_plus_view()
mayavi.mlab.savefig('test_streamplot_3D.png')
# more compelling examples can be produced for vesicles and other spherical systems